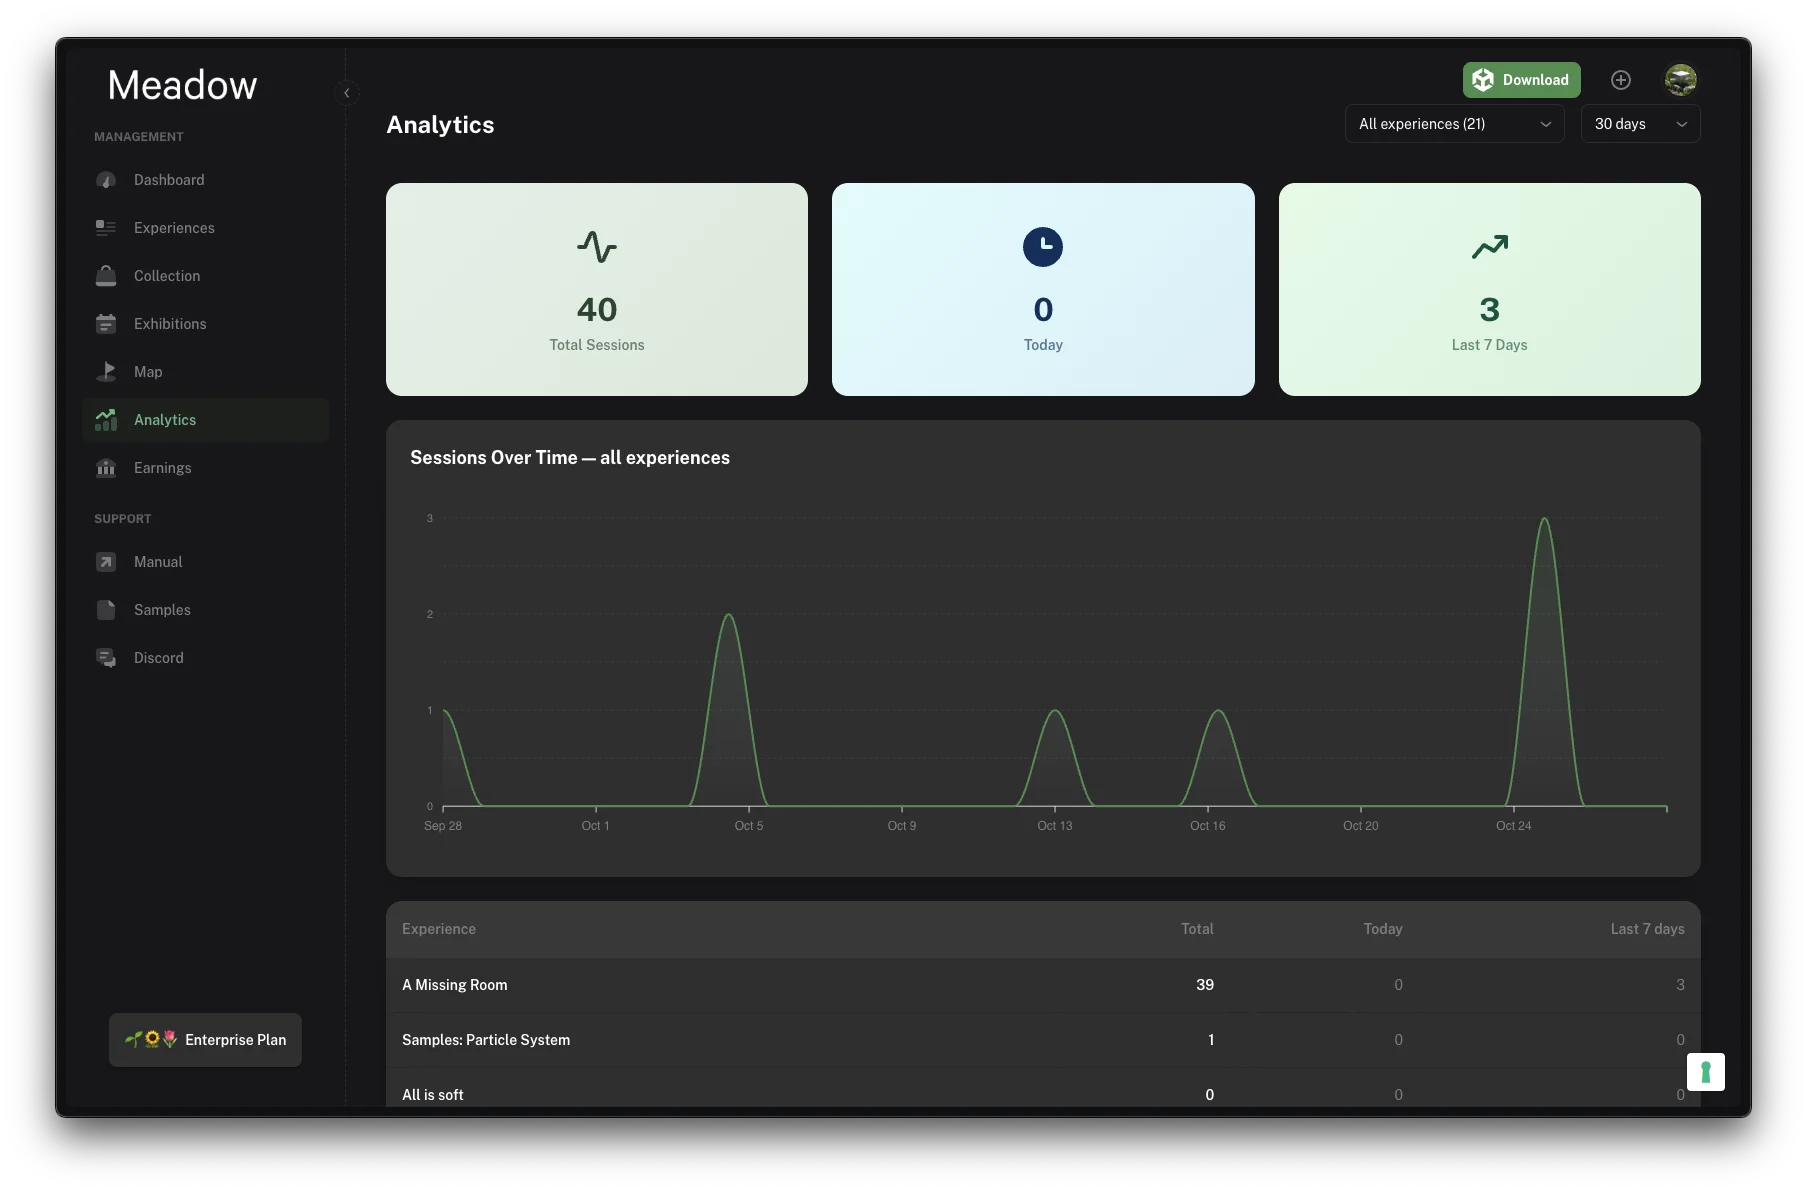
The Analytics dashboard shows how often your experiences are opened in the Meadow app. You can see the numbers for all your experiences together or for one experience, and follow them over time.
In the sidebar, under Management, click Analytics.
You can also start from an experience. On the experience’s page, click the Analytics button to open the dashboard already filtered to that experience.
What Is Counted
A session is counted every time someone opens one of your experiences in the Meadow app and it finishes loading. This includes experiences opened as part of an exhibition.
Every open counts. If the same person opens an experience three times, that is three sessions.
A session is counted when the experience starts, so it does not tell you how long people stayed.
Opening the experience’s web page at app.meadow.space/e/... is not a session. Only opens in the app count.
Days are counted in UTC. Depending on your time zone, “today” may begin or end a few hours earlier or later than your local day.
New sessions usually show up within a few minutes. The dashboard updates while you have it open, so you don’t need to reload the page.
Choose What to Look At
Use the two menus at the top right:
Experience: choose All experiences to see every experience you own added together, or choose one experience to see only its numbers.
Date range: choose 7 days, 30 days, 90 days or All time. The date range only changes the chart. The three summary cards always show the same numbers, whatever range you choose.
Summary Cards
Total Sessions is every session since tracking started.
Today is the number of sessions on the current UTC day.
Last 7 Days is the number of sessions today and in the six days before it.
Sessions Over Time
The chart shows sessions per day for the selected date range. Hover over the line to see the exact count for a day. With All time selected, the chart starts on the first day that has a session.
If an experience has not been opened yet, the chart says No sessions recorded yet instead.
Experience Table
When All experiences is selected, a table below the chart lists each of your experiences with its Total, Today and Last 7 days counts. The most opened experience is at the top.
Click an experience’s name to see the chart for that experience only.
Things to Know
Analytics show only experiences you own.
Sessions are counted from Meadow 1.5 onwards. Opens in earlier versions of the app are not included, so older experiences may show a lower total than they really had.
People still on a Meadow version older than 1.5 are not counted until they update.
Analytics do not yet show where, on which device or by whom an experience was opened.
Need Help?
If your numbers look wrong, contact support and tell us which experience it is.
On this Page
Analytics
The Analytics dashboard shows how often your experiences are opened in the Meadow app. You can see the numbers for all your experiences together or for one experience, and follow them over time.
In the sidebar, under Management, click Analytics.
You can also start from an experience. On the experience’s page, click the Analytics button to open the dashboard already filtered to that experience.
What Is Counted
A session is counted every time someone opens one of your experiences in the Meadow app and it finishes loading. This includes experiences opened as part of an exhibition.
Every open counts. If the same person opens an experience three times, that is three sessions.
A session is counted when the experience starts, so it does not tell you how long people stayed.
Opening the experience’s web page at app.meadow.space/e/... is not a session. Only opens in the app count.
Days are counted in UTC. Depending on your time zone, “today” may begin or end a few hours earlier or later than your local day.
New sessions usually show up within a few minutes. The dashboard updates while you have it open, so you don’t need to reload the page.
Choose What to Look At
Use the two menus at the top right:
Experience: choose All experiences to see every experience you own added together, or choose one experience to see only its numbers.
Date range: choose 7 days, 30 days, 90 days or All time. The date range only changes the chart. The three summary cards always show the same numbers, whatever range you choose.
Summary Cards
Total Sessions is every session since tracking started.
Today is the number of sessions on the current UTC day.
Last 7 Days is the number of sessions today and in the six days before it.
Sessions Over Time
The chart shows sessions per day for the selected date range. Hover over the line to see the exact count for a day. With All time selected, the chart starts on the first day that has a session.
If an experience has not been opened yet, the chart says No sessions recorded yet instead.
Experience Table
When All experiences is selected, a table below the chart lists each of your experiences with its Total, Today and Last 7 days counts. The most opened experience is at the top.
Click an experience’s name to see the chart for that experience only.
Things to Know
Analytics show only experiences you own.
Sessions are counted from Meadow 1.5 onwards. Opens in earlier versions of the app are not included, so older experiences may show a lower total than they really had.
People still on a Meadow version older than 1.5 are not counted until they update.
Analytics do not yet show where, on which device or by whom an experience was opened.
Need Help?
If your numbers look wrong, contact support and tell us which experience it is.